Dear Bitcoiners,
Each of us wanders through the wild jungle of Bitcoin prices, full of movements, peaks, and valleys. But those who look closely can see hidden patterns within the apparent chaos: movements that repeat and follow certain laws.
That’s exactly what SatoshisQuest.org aims to make visible, models that help identify better buying and selling opportunities. And they’re right more than half the time.
For HODLers, this means better entry points. Miners can find their optimal selling moments. Traders can use the rhythm of the market to accumulate more Bitcoin than they would by blindly HODLing.
Already implemented:
- Bitcoin Power Law
- Market Sentiment
- Bitcoin 14-Day Trend
Several more models are already on the to-do list. Many are already familiar with the Power Law and Sentiment models. Both are well-known frameworks describing Bitcoin’s long-term behavior and market mood.
What’s new, however, is the 14-Day Trend Indicator. And it’s well worth a closer look.
We tested this trend model using real Bitcoin price data — without any assumptions about market cycles or external factors. The dataset goes all the way back to July 18, 2010, and the approach was purely statistical:
- Model building based on historical data (e.g. n = 365 days).
- Fine-tuning the model parameters using the last 180 days within that window.
- The model automatically decides whether buying, selling, or holding would have produced a better outcome 14 days later (prediction = n + 14).
- Each prediction is then compared with the actual price data 14 days afterward — that’s the day of reckoning.
- With each run, the start date shifts forward by one day: t+1, t+2, t+m.
The results on real price data were so astonishing that we could hardly believe them ourself (Start Capital: $10,000, Forecast Horizon: +14 days):
| Model Period in days |
Buy | Sell | Trading Result | HODL Result | Factor (Trading / HODL) |
|---|---|---|---|---|---|
| 365 | 54.25% (of 1,187) |
38.63% (of 1,266) |
$33,300,873,206,630 | $87,355,683 | 381,286 |
| 1,461 | 54.14% (of 929) |
39.92% (of 982) |
$22,406,408,473 | $1,932,153 | 11,597 |
| 2,922 | 55.81% (of 611) |
41.86% (of 602) |
$34,250,793 | $151,939 | 225 |
| 5,110 | 66.34% (of 101) |
44.64% (of 112) |
$42,767 | $18,743 | 2,28 |
Three aspects of these results stand out most to me:
- Accuracy: The model’s “Buy” signal is correct more than 50% of the time — and improves as the model is trained on more data. In other words, more than half of all model-based decisions were right — without using any external signals.
- Robustness: Just 365 days of historical data are enough to build the model — and remember, 180 of those are used for fine-tuning.
- Outperformance versus HODL: The model consistently beats a simple buy-and-hold strategy — sometimes by a wide margin.
As for the varying degree of outperformance, we can only speculate for now:
- Larger training windows might reduce the number of remaining days available for evaluation.
- Smaller datasets may produce noisier but more profitable signals with higher variance.
If you’re still reading, you probably want to know how the model actually works.
A few weeks ago, Giovanni Santostasi introduced it, claiming it could outperform HODLing. We were skeptical, so we built it ourself, since it’s still not available anywhere online.
The model is based on the assumption that Bitcoin follows its Power Law. Power laws are observed in many other complex systems too, for instance, in the growth of cities.
The core idea is that complex systems often follow fat-tailed distributions, as described by Nassim Nicholas Taleb in Antifragile. He showed that extreme events in complex systems are far more likely than people assume.
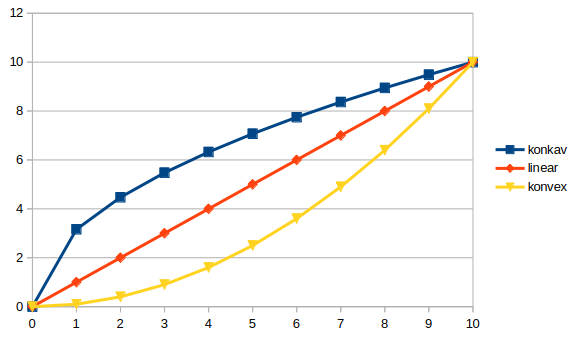
Exponential systems (convex) start out flat and accelerate rapidly until they hit their limits.
Logarithmic systems like Bitcoin’s Power Law (concave) start steeply, then gradually slow down, but remain stable in the long run.
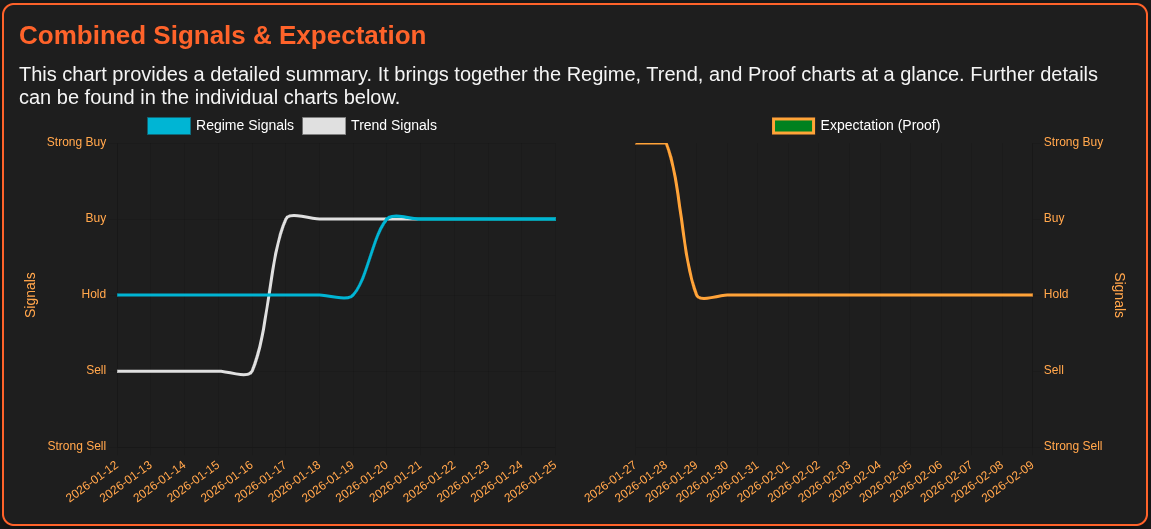
This is where the Trend Model ties in: it measures how strongly the short-term trend rises or falls and compares it to the long-term trend.
Taleb referred to this type of behavior through the character “Fat Tony” — representing markets that react not linearly, but in jumps and bursts of life.
The image of a wave captures it perfectly: watch Bitcoin long enough, and you’ll see movements like ocean waves — building, breaking, and flattening again.
The model shows which wave to ride — and when it’s too steep or too shallow.
It lets you navigate the market using pure statistics and observation, without relying on news or rumors:
- Short-term trend below the lower limit? Buy signal.
- Short-term trend above the upper limit? Sell signal.
That alone explains the remarkable results.
Bitcoin once again shows what makes it so special: it follows its own deep, inherent laws — ones that reveal extraordinary opportunities.
And you can use them too.
Don’t trust anyone’s statistics but your own? Go ahead, that’s exactly how we have started. 🙂
SatoshisQuest.org
Disclaimer
The content of this publication is intended for informational and educational purposes only.
It does not constitute investment advice, financial analysis, or a trading recommendation within the meaning of the German Securities Trading Act (Wertpapierhandelsgesetz, WpHG), the European Union’s Markets in Financial Instruments Directive (MiFID II), or the U.S. Securities Exchange Act of 1934 and other applicable securities laws in the United States or Canada.
All statements and analyses are based on historical data and model-based evaluations.
They are not guarantees of future performance and should not be construed as a solicitation to buy or sell any financial instrument, digital asset, or security.
Trading and investing in Bitcoin and other digital assets involve significant risk, including the possible loss of principal.
Users are encouraged to perform their own due diligence and consult with a licensed financial advisor before making any investment decisions.
No liability is accepted for any financial losses or damages arising directly or indirectly from the use of this information.
Statistics don’t lie, but markets sometimes do. 😉